Wednesday, May 29, 2013

Three ways to check your Power Pivot results.

Power Pivot is a good personal Business Intelligence tool. It should help you to give you better insight in what is happening in your company. The goal is to give insight, so you can take action to do it better in the future. Analyzing the data can results in 3 situations
  1. Results you expect.
  2. Positive results you do not expect
  3. Negative results you do not expect.
In case of situation 3: ‘Negative results you do not expect.’ people will doubt on the correctness of the report. This blog post will help you to analyze the correctness of the data in more detail. In my previous blog I explained the basics of Power Pivot. Pleas read this document before using this blogpost.

1) Add slicers to your report to get a dataset you can understand.
PivotTables and PivotCharts will show consolidated data. This can be a total of thousand or more records. Try to lower the number of records so you can understand the end result in the PivotTable or PivotChart. This can be done by defining some additional slicers which you can use to filter the data. For instance in a revenue report add the country, state and representative to the PivotTable. Now you can look to the revenue report for only one employee, in one country and one state.
How to add slicer to the PivotChart?
Select the Pivot Chart, Open tab PivotChart Tools Analyze.
Press the Insert Slicer button in the ribbon.
Select the country field from the debtor dataset.
Click to enlarge
Repeat these steps for other slicers like statecode or representative.

2) Add filters in Power Pivot window
The Power Pivot Window will show the import dataset records. In the Power Pivot you can filer the dataset to analyze a smaller set of data. For instance for year 2012 and period 6
Open the Power Pivot window. Open PowerPivot tab and select PowerPivot Windows button in the ribbon.
Click to enlarge
Select the dataset you want to filter. For instance InvoiceHistory. Select the drop down button in the column Invoice Year. Select only 2012. Press OK.
Click to enlarge
 Repeat these steps for other columns in the dataset. Look if you got the records you expect.

3) Use query analyzer to add filters to the view.The last step you can do is to analyze the dataset itself in the SQL Server Management Studio. (SSMS) .  For this you need to have knowledge of building TSQL queries.
First of all we need to know the query of the dataset in PowerPivot to import the data.
Select the dataset tab. Select Design tab, Press Table Properties button. In the Edit table properties window switch to: Query editor.

Click to enlarge
Select the query and copy it to your clipboard. (CTRL C)
Open SSMS, Open new query windows and connect to the database. Paste the query from your clipboard to the query window.
Now you can add WHERE clauses, JOIN’S with other tables etc  to the query.

Sunday, May 26, 2013

Global overview Power Pivot: The basics.

Introduction
In general Power Pivot is a datawarehouse engine within Excel.  If you use it with financial data of your company, you will get more insight in what is happening in our company. You can get insight from different perspectives. With this insight you can look how you can do it better. A Power Pivot sheet will contain the following components:
  • Datasets
  • Measures
  • Relationships between datasets
  • Time dimension dataset
  • PivotTables and PivotCharts
Datasets
Every Power Pivot sheet can contain one or more datasets. For instance you have a dataset for your Debtors and a dataset for your Invoices.  Dataset Debtors will contain all related Debtor information like, Debtor code, Country, State, Sector etc. Useful information is data which can be used filters or group by calculations etc. For instance, country of a debtor can be used to show revenue per country. Phone number is not useful because it is unique for one customer. Revenue per phone number is the same as the revenue per debtor.  Datasets are defined in the Power Pivot Window. The Power Pivot Window button is part of the Power Pivot tab of the ribbon.
 
Example of the dataset debtors:


Example of the dataset Invoices: 
Dataset Invoices: Click to enlarge

Measures
In every dataset you can define measures. A measure is a formula that is created specifically for numeric data that you want to summarize or analyze in a PivotTable or PivotChart. Measures can be based on standard aggregation functions, such as COUNT, AVERAGE or SUM, or you can define your own formula by using DAX.
Example of measures on the Invoices dataset, like Invoices, Invoices per Customer, Invoiced customers, Average Invoice amount  etc.

Defined measures will be available in the Power Pivot field list and can be recognized by the calculator symbol.

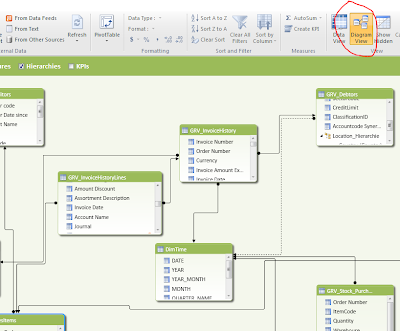
Relationships between datasets  Datasets can be linked to each other by creating a relationship between the tables. The relationship establishes how the data in the two tables should be correlated. For example, a Debtor table and an Invoice table can be related in order to show the customer name that is associated with each order. After you have defined a relationship between tables in the Power Pivot window, you will be able to filter data by using related columns, lookup values in related tables, and integrate columns from multiple tables in a PivotTable. To understand with related columns can be used, you need to look to the defined relations. Open the Power Pivot window and press on the Diagram View button in the ribbon.
Diagram View: Click to enlarge
Time dimension dataset
To make use of the powerful Time intelligent functions it is recommended to create a separate related time table. To create such a table read: http://www.keepitsimpleandfast.com/2012/09/script-to-generate-time-dimension-table.html  The TimeDimension table contains characteristics of all days. For instance the day 24 may 2013. Some examples of the characteristics of this day: Year: 2013, Month: 5, It’s a Friday, Quarter 2, ISO week number: 21 All these different characters can be used in your pivots. Link your time dimension table to the date columns on your other datasets. For instance link Invoice date of your Invoice table to the date column.

This enables you to build revenue reports per week, month etc.
PivotTables and PivotChartsAfter having defined datasets, relationships, a date time table and measures, we can start building the reports.  Select the Power Pivot Tab in the ribbon, Select PivotTable and select what you want to insert.

You will get the Power Pivot field list which you need to use to define your chart. 

This will result in next chart:

Add a second chart or pivot to the same sheet. If you change slicer values of the previous chart, the added pivot or chart does not change. You need to link the added chart or pivot to the slicer. To do these select the added chart or pivot. Select the Pivot Table Tools, Options tab. Select Insert Slicer, Slicer Connections. You will get a list of all slicers. Select the slicer of the current sheet. The slicer is now active on both charts\pivots. You can check this by changing the slicer values.

Friday, May 24, 2013

How to retrieve IO statistics of SQL databases on file level?


Performance of a SQL database depends on different factors. One of these factors is disk activity, also known as Disk IO. With Windows Performance monitor (Perfmon) you can measure the performance of your disk. However if you have 4 database files on 1 drive, you do not know which of your databases is causing the most Disk IO. Within SQL Server you can use a dynamic view which will give you information on database file level.  Execute next statement on the SQL Server:

SELECT d.name  ,s.filename, NumberReads,  NumberWrites,  BytesRead,BytesWritten,
 IoStallReadMS, IoStallWriteMS, IoStallMS,BytesOnDisk
FROM Fn_Virtualfilestats(NULL,NULL) f
INNER JOIN sys.sysaltfiles s ON f.dbid = s.dbid and f.FileId = s.fileid
INNER JOIN sys.databases d ON f.DbId = d.database_id
ORDER BY IoStallReadMS DESC

This query will show next columns:

Name: Database name
Filename: Filename of the database file. Look to the extension to see if it is the MDF or LDF file
Timestamp: Database timestamp at which time the data was taken
Number of reads: Number of reads issued on the file
BytesRead: Number of bytes read issued on the file
IoStallReadMS: Total amount of time, in milliseconds, that users waited for the read IOs to complete the file
Number of writes: Number of writes issued on the file
BytesWritten: Number of bytes written issued on the file
IoStallWriteMS: Total amount of time, in milliseconds, that users waited for the read IOs to complete the file
BytesOnDisk: Physical file size(count of bytes) on disk.


With this query, you can look which databases are generating the most IO and time database files are waiting on the disk to get the required data. This can help you to decide to move some database files to seperate disks.

Friday, May 10, 2013

The connected user is not an Analysis Services server administrator. Only an administrator can make changes to server properties

You are a part of the local administrators group on the server. You want to add a user to the Server administrator group of your Analysis Server. After adding the user you will get next error message: The connected user is not an Analysis Services server administrator.  Only an administrator can make changes to server properties.

Solution: Start SQL Server Management Studio with the option 'Run as Administrator'. Now it is possible to add users to the Server administrator group of your Analysis Server.